On this pageOverview
  1. Overview
  2. Research
  3. How it fits together
  4. Product decisions
  5. Delivery and reflection
  • Fleet electrification
  • B2B platform
  • 2023–2024

EV fleet charging

Is the fleet ready? Operators needed three tools to find out.

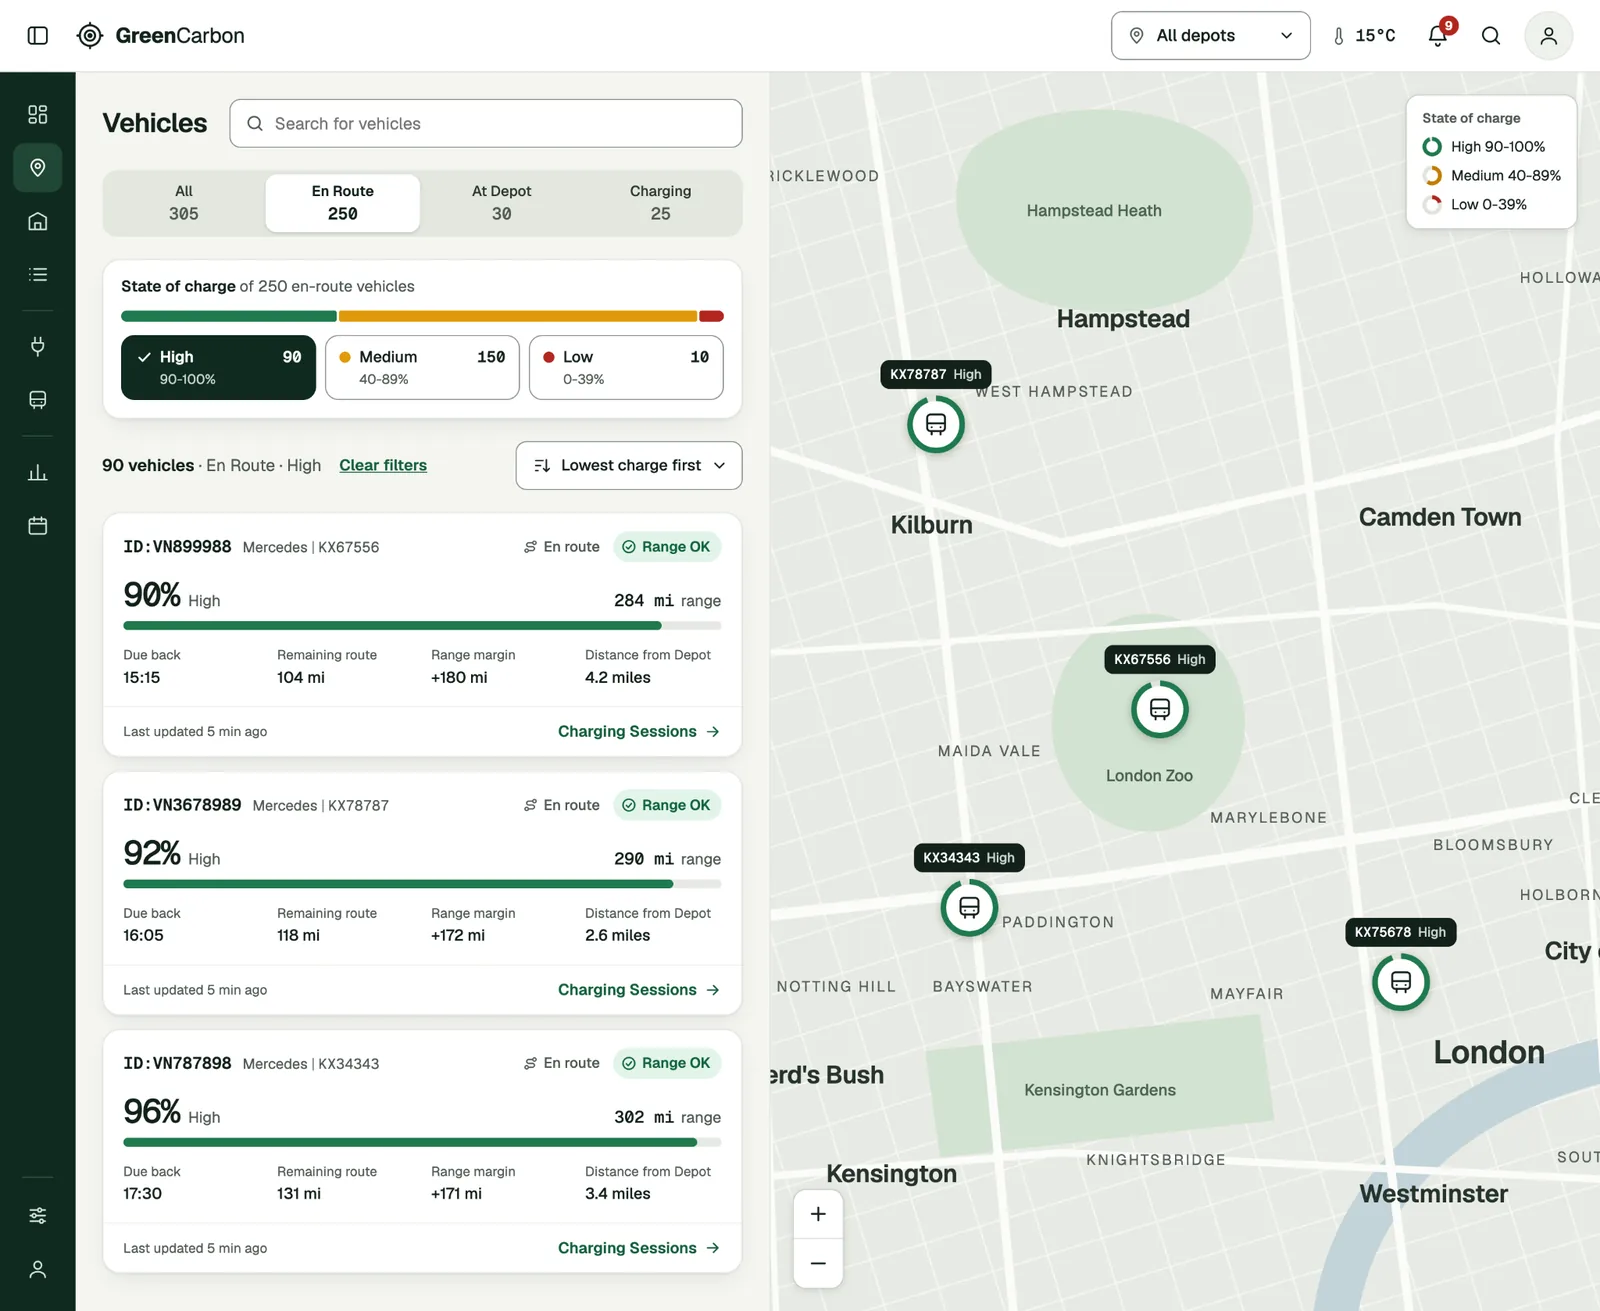
Fleet Location in the GreenCarbon reconstruction. A list of en-route vehicles, each with its charge level, range and distance from depot, beside a map of London showing where each vehicle is.
Illustrative reconstruction with fictional branding and data. The project tested wireframes. The screens on this page are redrawn for the case study.
30/30tasks completed in round-two testing
0errors in those tasks
5–14 secper task, in one or two clicks
4improvements shipped in the existing platform

Round two of usability testing: six participants, five tasks each, on wireframes of Fleet Location and Facility View.

Product
An operations platform for electric fleets and depot charging. The company ran charging for fleet operators as a managed service and wanted to sell the platform on its own too.
My role
Senior Product Designer, and the only designer on the platform. I ran the research, redesigned the fleet location, depot charging and dashboard views, tested the concepts and proposed what the business could offer customers next.
Timeline
Dec 2023 to Jul 2024
Methods
  • Competitive benchmarking
  • Interviews
  • Contextual observation
  • Jobs-to-be-done
  • Kano prioritisation
  • Journey and flow mapping
  • Workshops
  • Wireframes
  • Usability testing
Business ambition
Turn three disconnected tools into one complete offering. The business wanted to sell fuller, configurable solutions and win more contracts.
Problem
To understand one issue, operators gathered vehicle, charger and facility information from the company’s own platform and two third-party charging-management tools.
Outcome

Testing changed two of my three main decisions, and both changes were built into the product.

Four improvements shipped in the existing platform, and the team measured shorter task times afterwards.

Research

Feature requests were only part of the problem.

I chose interviews and observation to see how people completed daily checks and investigated problems. Watching their routines showed repeated work that a list of feature requests would miss.

3separate systems used to check daily operations
1morning question: are vehicles ready for service?
0single view connecting vehicles, chargers and facilities

Observation, then product implication

A screen change could erase the work.

One participant left Analytics to check a vehicle’s charger. When they came back, their selections were gone.

Why jobs-to-be-done

Job titles overlapped, so I designed around tasks.

I grouped needs by what people were trying to do, such as checking readiness or investigating a charging problem.

Why Kano

Requests mixed expected features, extras and unused ones.

I used Kano categories to discuss with the team how meeting or missing each need would affect users.

User differences, then research boundary

Internal needs were not customer needs.

What we knew about customers with in-house teams came from sales and one customer conversation. I treated the differences as assumptions to validate.

The five jobs

  • Check readiness at the start of the day. Vehicles that haven’t charged and issues needing attention.
  • Monitor charging operations. Charger status, charging progress and fleet availability.
  • Analyse performance. Charging data, energy consumption and recurring problems.
  • Troubleshoot and resolve issues. Diagnose faults, coordinate support and restore service.
  • Report and document. Service performance, incidents, actions and changes.

Three features, in priority order

  1. One place to soft-reset and hard-reset hardware.

  2. Easier filtering, with the most important filters surfaced.

  3. Configurable alerts using multiple criteria for charging sessions or hardware.

How it fits together

Design the relationships behind the screen.

One platform had to work for two kinds of customer. I mapped where their needs pulled apart and made one call for each.

Two kinds of customer

The difference between them was modest but real. It shaped what each one wanted to see.

Managed service

The company’s own team runs charging for the client across depots. They investigate problems in depth and need the detail to do it.

Standalone product

The client’s in-house team runs the platform themselves. They set it up their own way and want to see their own priorities first.

Where the needs pulled apart, and what I did

Trade-offMy callLinks to
Everything people asked for, against what is essentialState of charge leads every view. Long-term data moved to the vehicle page.Decision 1
One unified product, against tasks at different scalesOne product, with separate views for the road and the depot.Decision 2
The internal team’s setup, against an in-house team’s setupThe essentials are shared. Widgets let each customer bring their own priorities forward.Decision 3

Two views, three levels

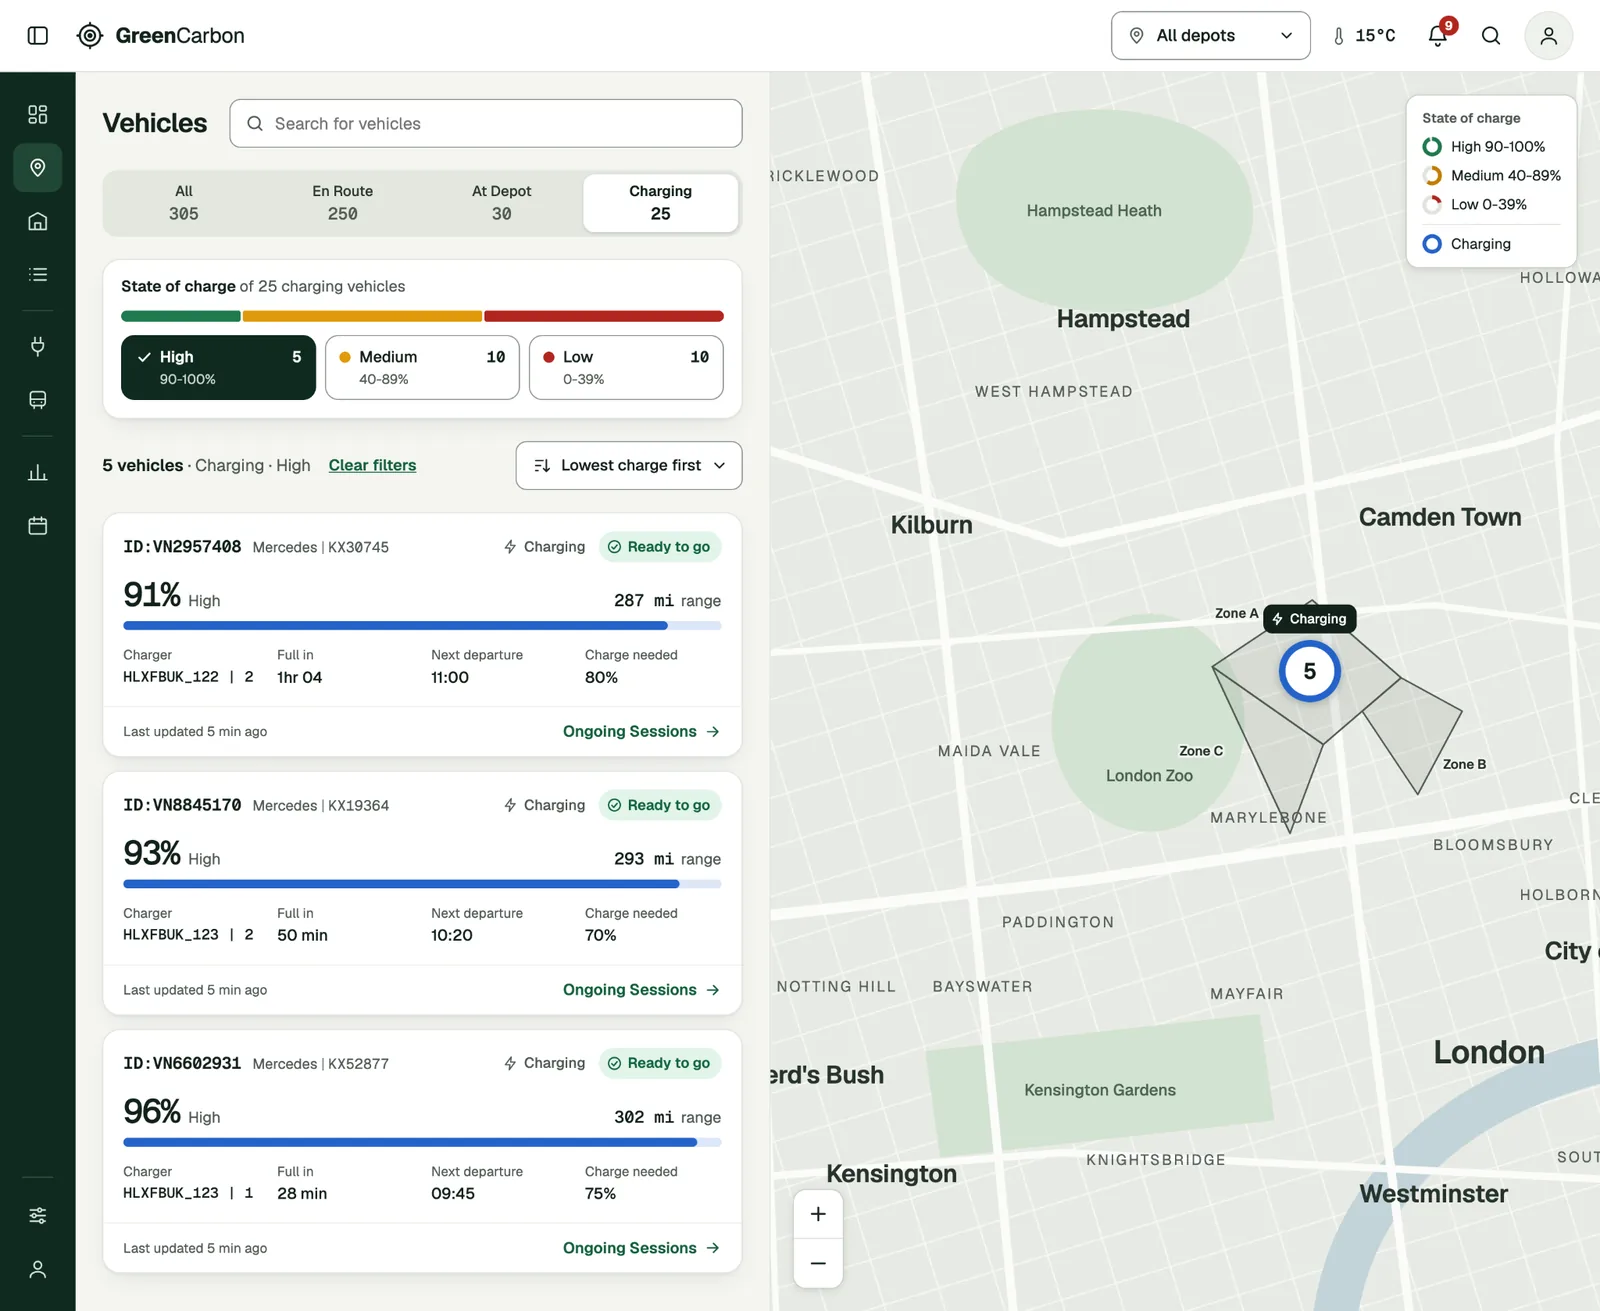
Fleet Location is geographic. Facility View opens as a schematic of the whole depot, then goes down to a single zone.

ViewQuestionWhat it shows
Fleet Location, geographicWhere is every vehicle?Live position, charge state and distance from depot.
Facility View, schematicIs the facility ready?Charger availability, faults and capacity by zone.
Facility View, zonalWhich bay needs action?Per-vehicle status at the level operators work.

A vehicle and its charger stay linked on every screen.

  1. Operators filter by status and charge together. The count, the cards and the map all follow.

Fleet Location filtered to en-route vehicles with high charge

Product decisions

Three decisions. Testing changed two.

I used wireframes and two rounds of usability testing to check whether people could find what they needed and complete their tasks.

1Information priorityShipped

What does an operator need to decide a vehicle is ready?

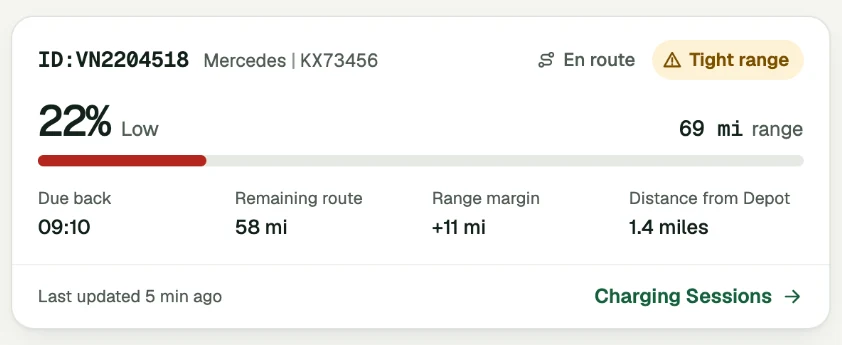
My first map tooltip led with sustainability and battery health. Participants needed state of charge, distance from depot and the time of the last update. I put those first, added priority sorting and moved the rest to the vehicle page.

Outcome

State of charge leads the visual hierarchy. When it is critical across many vehicles, the operator sees it and can act. The change was built into the product.

First concept

  • CO₂ savings
  • Battery warranty
  • Battery health

After testing

Vehicle card showing 22% charge, 1.4 miles from depot and last updated 5 minutes ago
  1. Charge level
  2. Distance from depot
  3. Last update
The same priority, shown on a vehicle card in the reconstruction.

2Task boundaries, the idea I droppedShipped

Would one map for vehicles and chargers be simpler?

The platform had separate views for vehicle locations and depot charging. I proposed merging them to save switching. In round one people struggled with the zoom levels and controls, and one participant abandoned the task. I went back to two views.

Outcome

Round two: six participants completed 30 of 30 tasks with no errors. The product kept two separate views.

Round one, one combined map

Vehicles and chargers together. One participant abandoned the task.

Round two, two views

Fleet Location answers “Where are the vehicles?” Facility View answers “What needs attention at the depot?”

30 of 30 tasks completed. No errors.

3Configuration and packaging

How could one product fit customers with different goals?

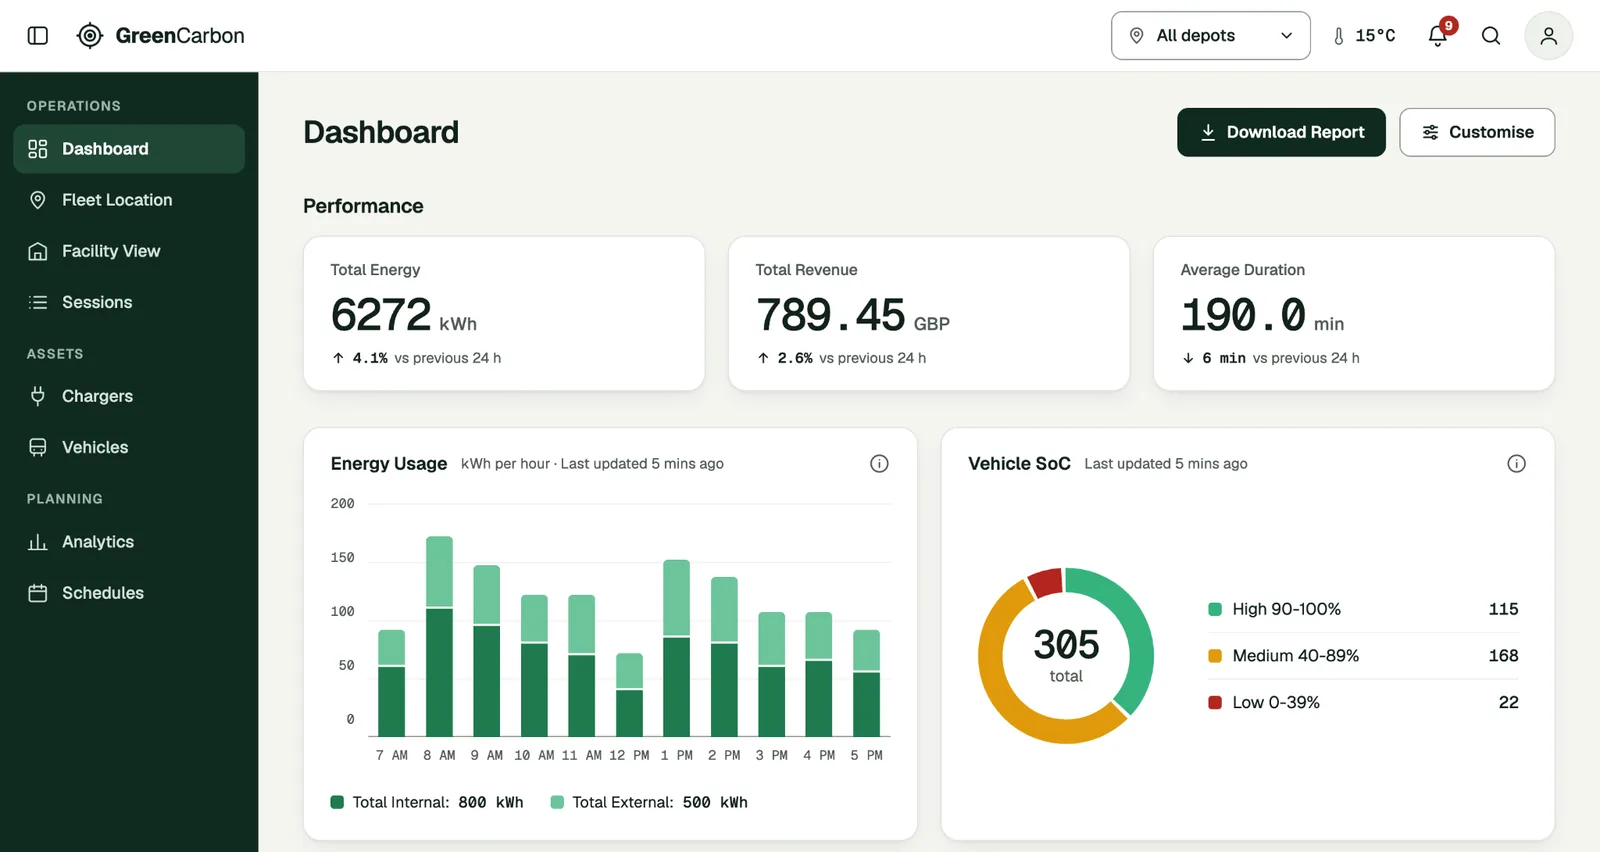
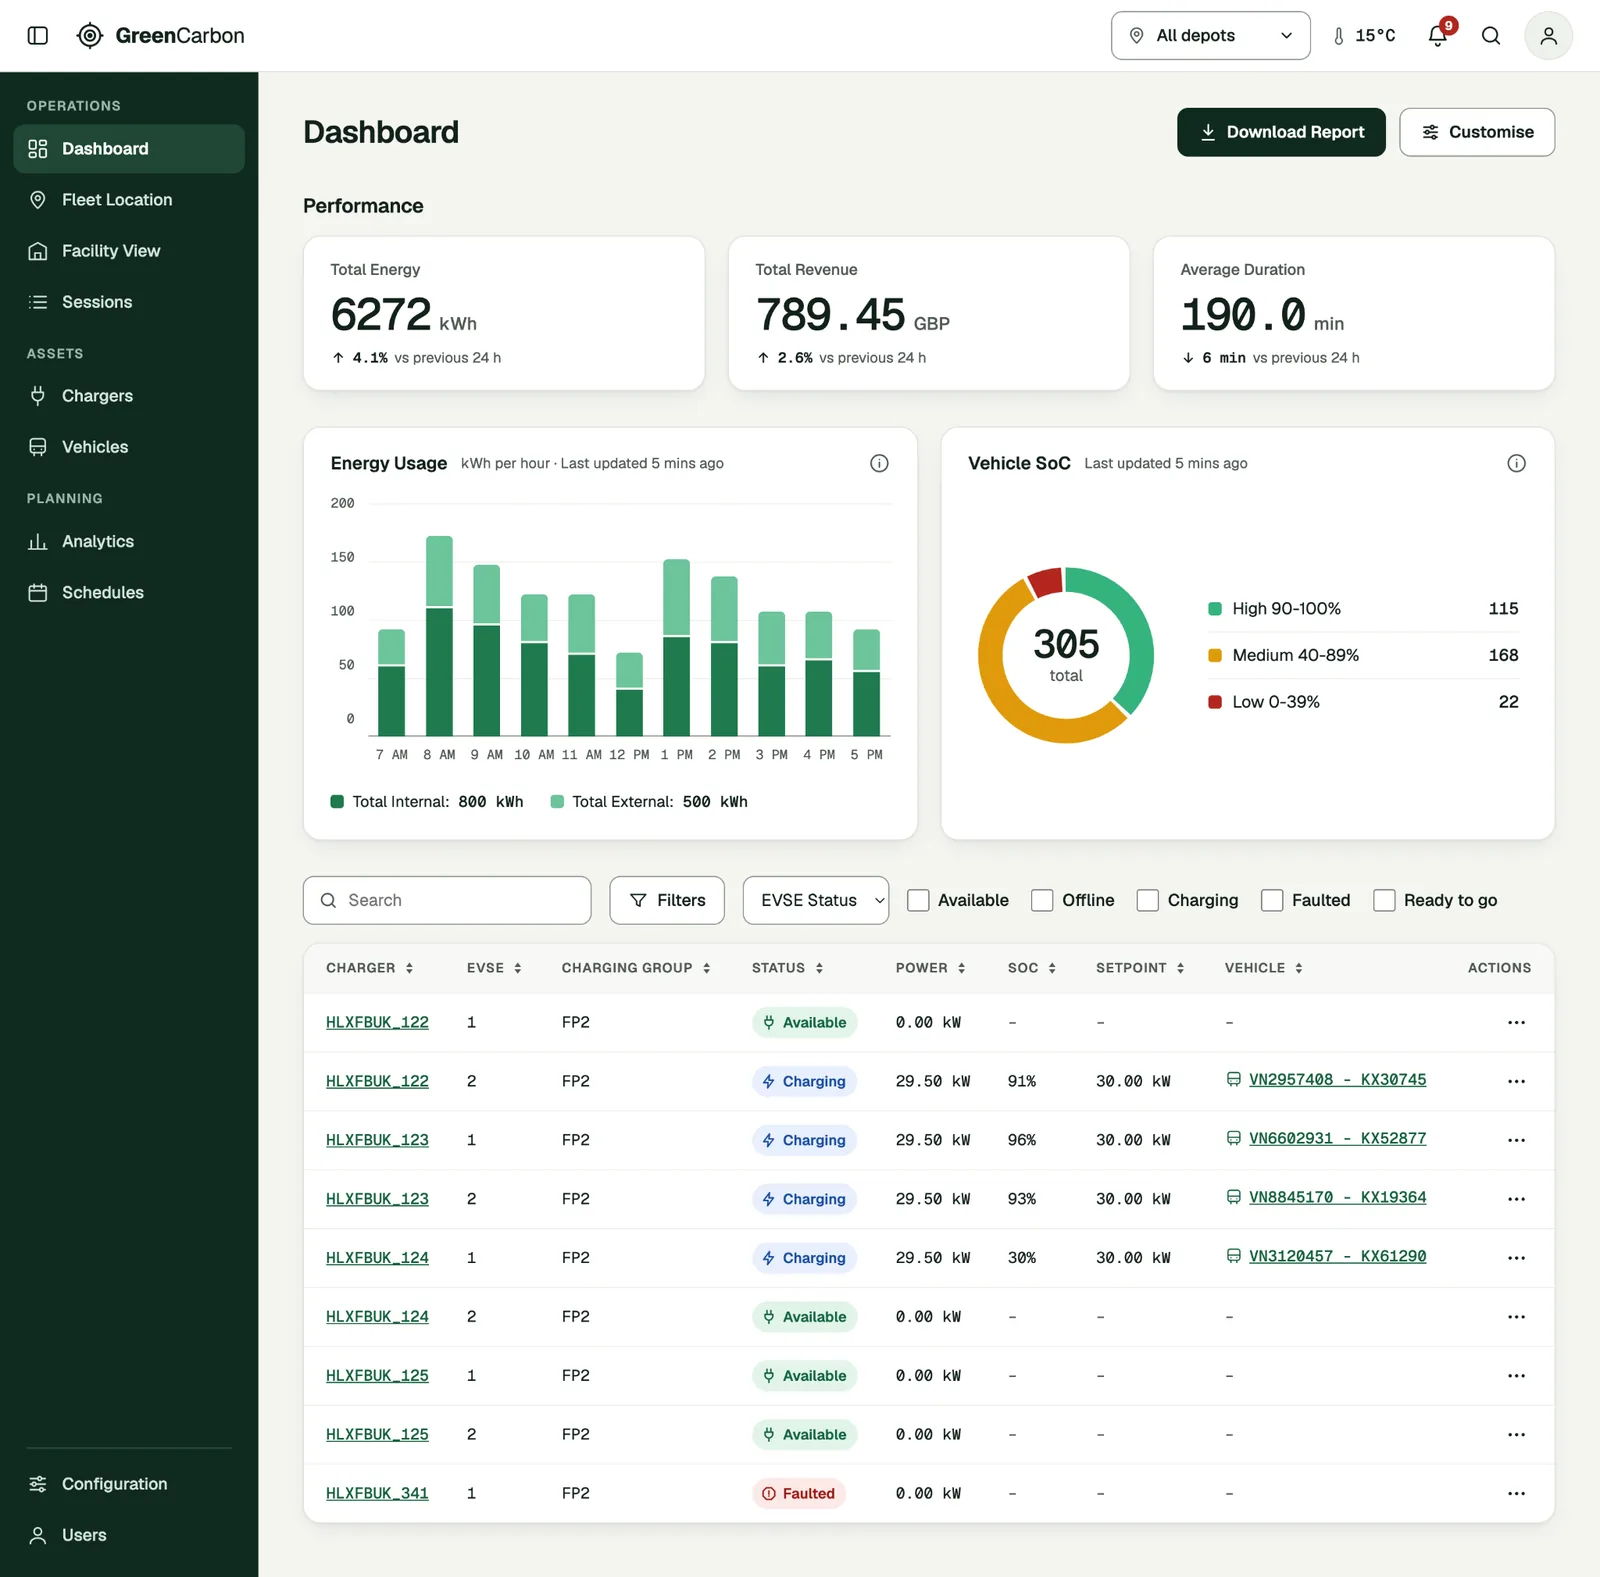
Customers had different goals and service packages: managing charging, keeping operations reliable or cutting charging costs. I proposed a dashboard built from widgets. Each customer selects what is relevant, and the business can offer extra widgets as part of its packages.

Outcome

A direction for the product and for what the business sells. Next step: validate the setup with customers who run their own depots.

Dashboard with performance tiles, an energy usage chart, a vehicle state-of-charge chart and a Customise button

Delivery and reflection

The focus shifted. The evidence still guided delivery.

An urgent problem in the existing platform moved the team’s attention there. I used the research to help choose what to change first.

What shipped

  • The new tooltip priority, as tested.
  • Two separate views for the road and the depot, as tested.
  • More filters for vehicles, chargers, status, location and priority.
  • Clearer engineer notifications with the required action and urgency.
  • Better vehicle and charger information.
  • Maps that make assets easier to find and their status easier to read.

How we chose

We compared requests by how often the problem occurred, the effort it caused, who it affected and the cost of addressing it. The unified, configurable product stayed the longer-term direction.

Result

The team measured a reduction in task completion time after the changes were introduced. The exact figures are confidential.

What I would change

I would agree the near-term scope and the longer-term direction with product and engineering earlier. I would also seek direct access to customers running their own depots.

Client name withheld. Participants anonymised. Screens are portfolio reconstructions with fictional branding and data. Range and departure indicators are later additions.